|
|
 |
|
|
|
|
Tools
Turning experience and knowledge into tools that can be used by others has always been important. Dr. Katznelson has been developing planning tools for environmental monitoring, educational tools (e.g. Urban Runoff Game), and data management tools for decades.
Clean Water Team (CWT) Tool Box for Environmental Monitoring
In addition to the Clean Water Team Guidance Compendium Guidance Compendium for Watershed Monitoring and Assessment, this Toolbox has template files and documents that help users manage and organize their water quality monitoring data. Most of the items are part of the Data Quality Management (DQM) system that Dr. Katznelson and the Clean Water Team has developed for the collection management and sharing of reliable data of known quality.
Part 1: The Basics: A MS Excel workbook for capturing field measurement Results and all relevant information about the Results.
Part 2: Data Validation Kit: A platform with spreadsheets for streamlined Data Quality Management, including error calculation
Part 3: Advanced Tools: The full DQM Project File, including placeholders for all data elements that are essential for Project operations
Part 4: Monitoring Project Planning Kit: Guidance and templates for a systematic process of designing a monitoring project, including sampling design, methodology, logistics, and labor
( The DQM Project File has been updated recently to enhance data entry in the field using a mobile device. Right-click and select 'save target as' to download the 2013 DQM Project File for Tablet/PDA, a 0.3 MB Excel workbook)
The SWAMP Advisor, an Expert System for creating a Quality Assurance Project Plan (QAPP)
Dr. Katznelson collaborated with Dr. Laurence Keith on construction and testing of an on-line Expert System dedicated to developing Quality Assurance Project Plans (QAPPs) that are compatible with the rquirement of the California Surface Water Ambient Monitoring Program (SWAMP). Dr Katznelson introduced the concept of following separate loops for separate study questions and lines of inquiry in a single QAPP, and developed the Measurement Core Loop ( Power-Point Presentation)) and the Study Intent & Design Loop for the Advisor software.
Additional Data Management Tools
The FlexiGrid System for Management of Spatial Monitoring Data
Manuscript of "The FlexiGrid: a universal spatial sampling frame"
The FlexiGrid concept was articulated by Dr. Katznelson in 2007, in her efforts to manage monitoring results that are associated with multiple spatial components. This concept supports a data structure that can achieve the following:
A. Connect each monitoring Result to the exact spatial component it was measured in (or to an aggregate thereof);
B. Place every spatial component on a ‘virtual map’ as an independent entity while preserving the internal hierarchy and its order in a series; enable reconstruction of the Frame from the virtual map that is stored in database cells; and allow information transfer into a GIS system;
C. Integrate physical habitat (PHAB) results and descriptors with results and descriptors from any other area of inquiry (e.g., chemistry, toxicity, bioassessment, etc.);
D. Enable reporting of any type of Result and Endpoint, generated for any Characteristic in any spatial component and at any scale, on the ‘same page’; and
E. Accommodate data generated by PHAB protocols used by different Agencies and Programs (e.g., NAWQA, EMAP, EPA RBP, DFG Fisheries habitat, SWAMP, etc.).
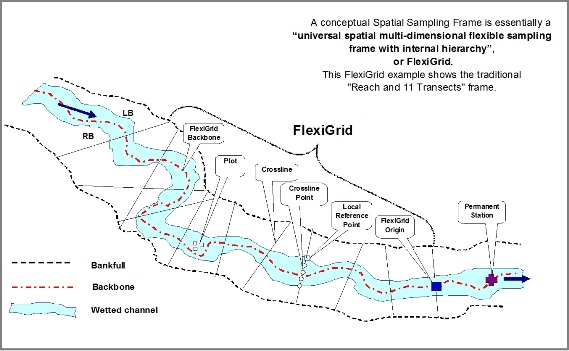 The FlexiGrid is a spatial multi-dimensional flexible sampling frame with internal hierarchy. It is “laid out” on a stream channel by one Team in one Station Visit. It can contain a variable number of dimensions, components, and angles. It refers to permanent locations, but it is not permanent itself (FlexiGrids may be laid out differently at different times). It can serve different kinds of protocols from any area of inquiry that requires spatial representation of a monitoring Result.
Dr. Katznelson has successfully applied the FlexiGrid concept in support of physical habitat assessments in California, making extensive use of the Excel tools she has built. These include the Data Entry template, the Endpoint Calculation template, and the Crosswalk that allows for transfer of data from the FlexiGrid into other databases.
Educational Games
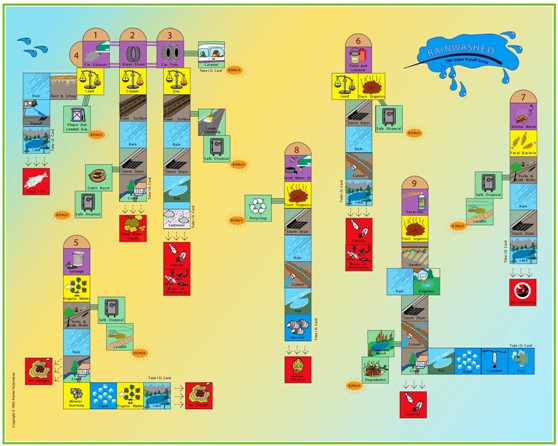
'Rainwashed: The urban Runoff Game
This game shows how the pollutants we generate in our daily lives reach our waterbodies, what problems they cause, and what we can do to reduce their impact. Game play involves tracking the pathway of each pollutant by placing cards on the board in sequence. Played in classrooms on a vertical poster-size board and magnetic cards, kids were having fun while learning important facts. Please contact Revital for more information about the game content and about facilitation of 'Rainwashed play in your classroom.
|
|
|